


A little background before we start. LLM inference occurs in two phases:
Prefill, which processes the input prompt and creates the KV cache. Since it involves processing all tokens in the input prompt together, it is compute-bound.
Decode, which generates tokens one at a time, autoregressively. It is memory-bandwidth bound because very little computation is performed at each step relative to the amount of data (primarily model parameters and the KV cache) moved from memory.

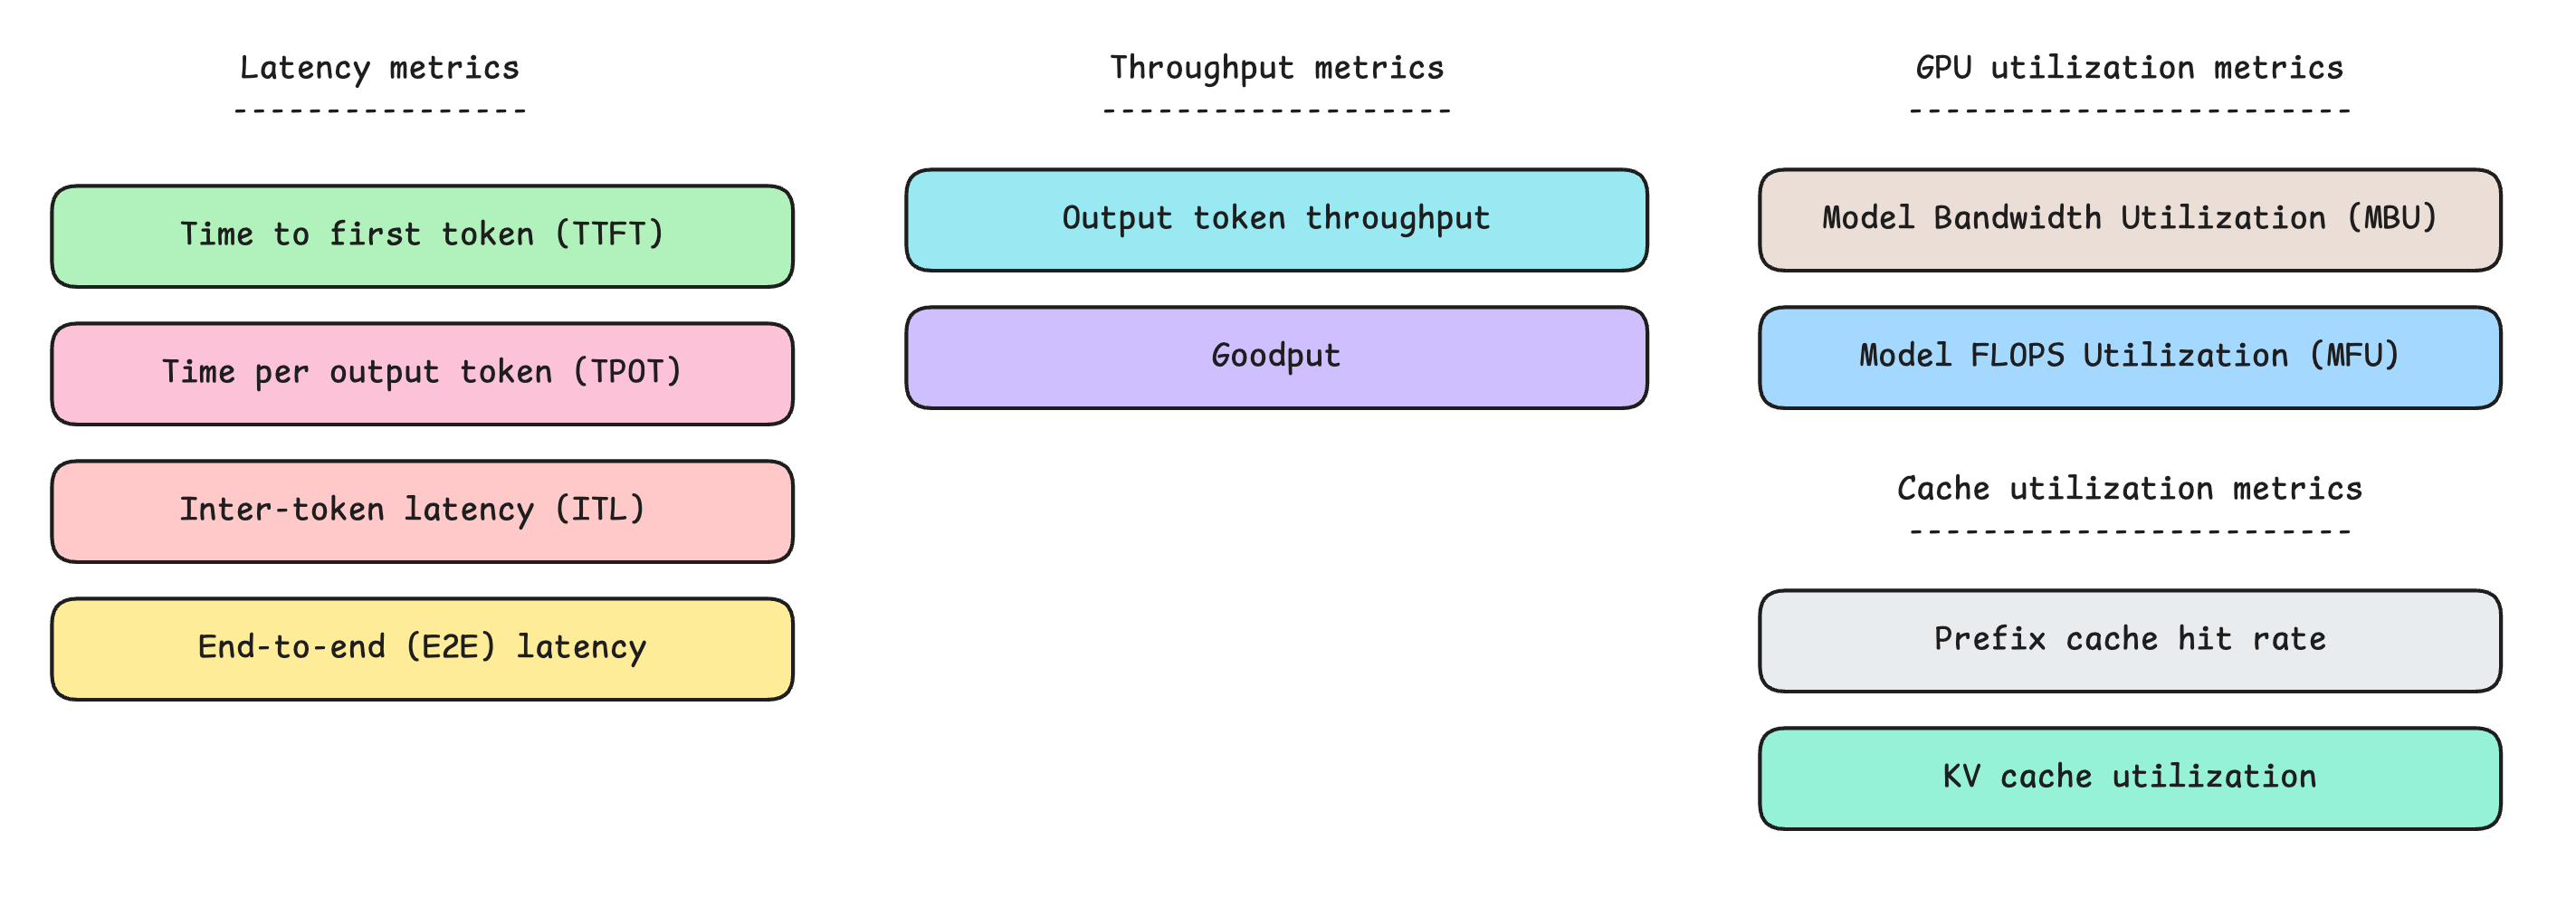
Now that we understand this, here are the 10 inference metrics that you must know when deploying LLMs in production. Metrics 1-4 measure latency, 5-6 measure throughput, and 7-10 measure the efficiency of GPU compute, memory, and cache usage.
1. Time to first token (TTFT)
This is the time between the request’s arrival at the serving system and the generation of the first token.
TTFT is the latency metric that users perceive when interacting with an LLM-based system. It is what makes or breaks an interactive workload such as a real-time chat application.
It is determined by:
Queue time, which means the time between request arrival and the forward pass through the LLM. This is when a request is waiting for GPU/batch resources. Higher queue time means longer TTFT.
Length of the input prompt: Longer prompts take more time to process during prefill, resulting in a longer TTFT.
Prefill compute: The higher the compute available, the lower the TTFT.
When optimizing for low TTFT, it must always be determined whether the cause is a bottleneck in the serving system or the GPU's compute limitations.
2. Time per output token (TPOT)
TPOT is the average time to generate each token during Decode. The first token is excluded as it is a result of the Prefill.
The faster an LLM’s parameters can be moved from memory, the faster token generation during Decode is, and the lower the TPOT is.
TPOT is determined by:
The number of model parameters and their precision (lower means lower TPOT because the amount of data moved per decode step goes down)
Context length (higher values mean higher TPOT because longer sequences increase KV‑cache size that must be read to generate each token)
Batch size (higher values mean higher TPOT because more concurrent computation must occur per decode step)
GPU memory bandwidth (higher values mean lower TPOT because data can be moved faster from memory during Decode)
3. Inter-token latency (ITL)
ITL is frequently confused with TPOT. While TPOT measures the average time per generated token during Decode, ITL measures the latency between two consecutive generated tokens.
In simple terms, TPOT is the average of a request's ITLs.
For example, if the latency between tokens in a response is 42 ms, 46 ms, 60 ms, and 35 ms, these individual numbers are the ITLs, and their average (45.75 ms) is the TPOT.
When serving an interactive application, it is important to ensure that ITL remains consistent. Otherwise, the interaction will feel jittery, leading to poor user satisfaction.
The metric to consider in such cases is the p99 ITL, or the 99th percentile inter-token latency. As an example, if p99 ITL is 120 ms, it means 99% of ITLs are 120 ms or less, and the slowest 1% are above 120 ms.
p99 ITL is called tail latency because it measures latency in the high-percentile tail of the latency distribution.
